Analysis and Reports
DashBoards
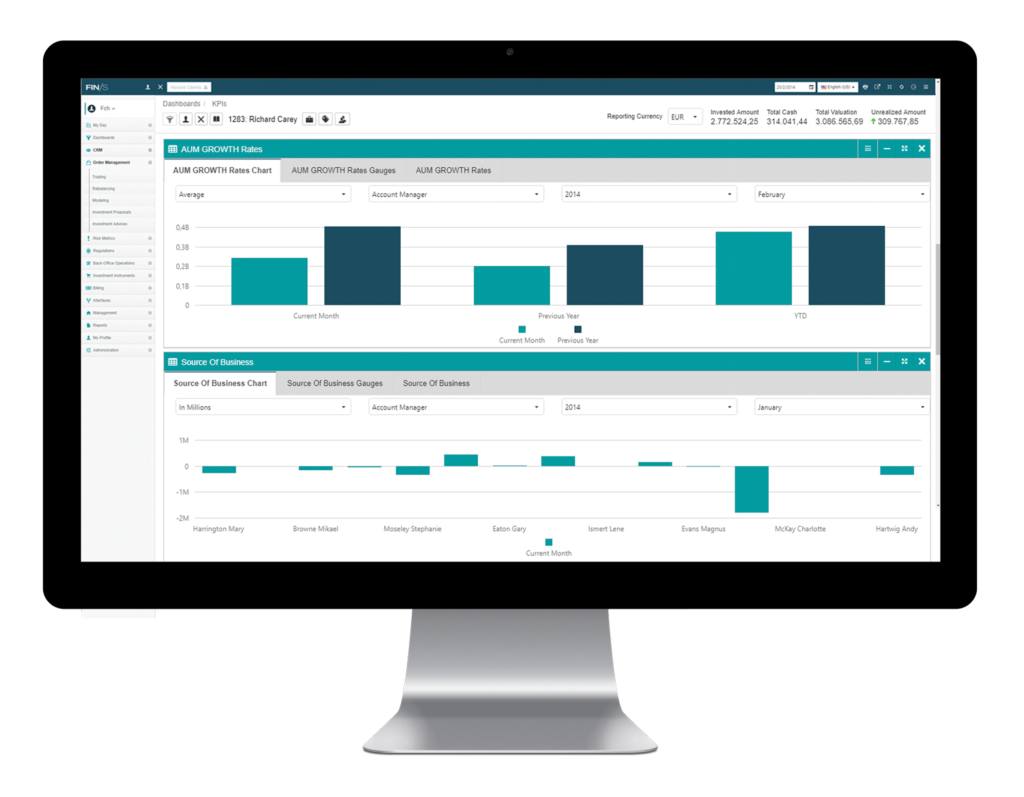
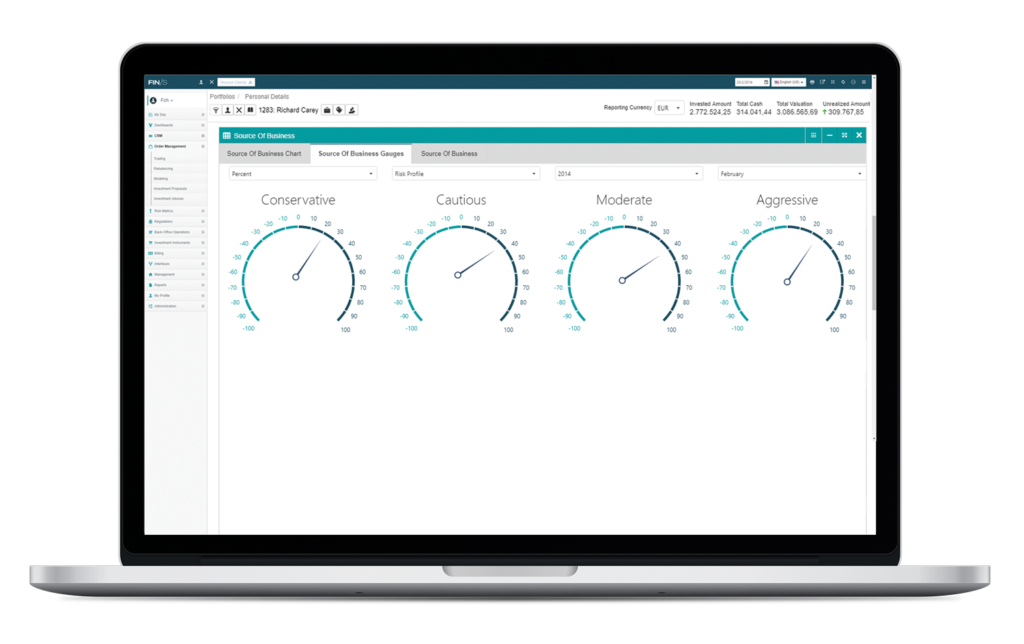
FIN/S dashboards provide Management, Relationship Managers and Advisors with all necessary information regarding the clients under management in a modern and user-oriented way.
Data are designed and presented in different schemes, such as crosstabs, pie charts, bar charts or gauges, offering an overall view of the clients and the investment instruments, while drill down processes and reporting tools facilitate users on their daily tasks.

Furthermore, KPI’s provided offer important statistics that are useful for management purposes:

Portfolio Performance Analysis
EFFECT offers enhanced functionality for measuring performance, either by money or time weighted return formula.
Through easy steps, the system provides all the information needed by portfolio managers to assess and present their investment portfolios. Moreover, period or annual returns can be easily calculated, either for the whole portfolio or specific sectors or even specific investment products. Performance can be calculated by either including all expenses or specific categories of expenses or by excluding all expenses.
At the same time, the system calculates the performance for benchmark and model portfolios.
More specifically, Performance Analysis module includes:
-
Calculation of performance for any period, including or excluding expenses
-
Calculation of Realized & Unrealized gains or losses
-
Performance history
-
Portfolio vs Benchmark
-
Contribution to performance
-
Performance report